
This blog is going to cover how to control the temperature of a mixing tank using Functional Block Diagrams and Sequential Function Charts in DeltaV. The heating process will be simulated in real time and the program will follow this general recipe.
- Switch on the mixer.
- Add water (10 seconds) and milk powder (5 seconds).
- Heat the mixture to 60°c.
- Keep the mixture at 60°c for 10 seconds.
- Cool the mixture to 20°c.
- Transfer out the mixture.
- Turn off the mixer.
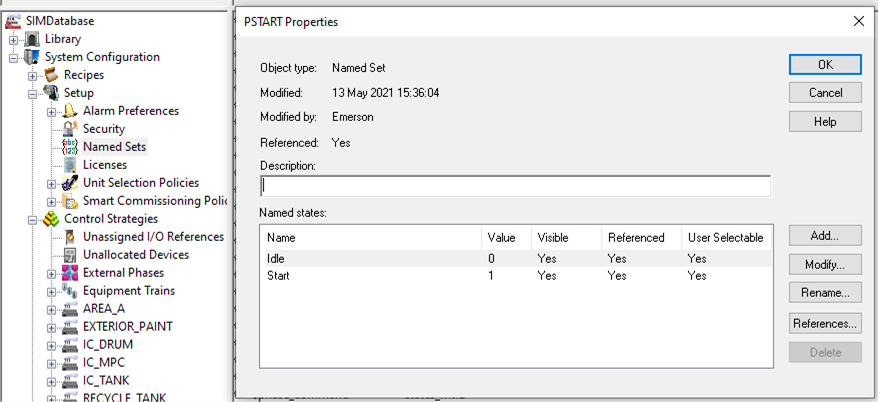
Named Sets:
First you will need to create a named set with 2 states: Idle and Start. These are operational states which will be toggled on the user interface, a start button in this case.
Functional Block Diagram:
This FBD, or functional block diagram, will function as the equipment in this demonstration. It is comprised of 4 pairs of digital I/O and a controller for modelling the temperature in the mixing tank. These blocks will be referenced later by the Sequential Function Chart where their operations will be linked together to form logic.
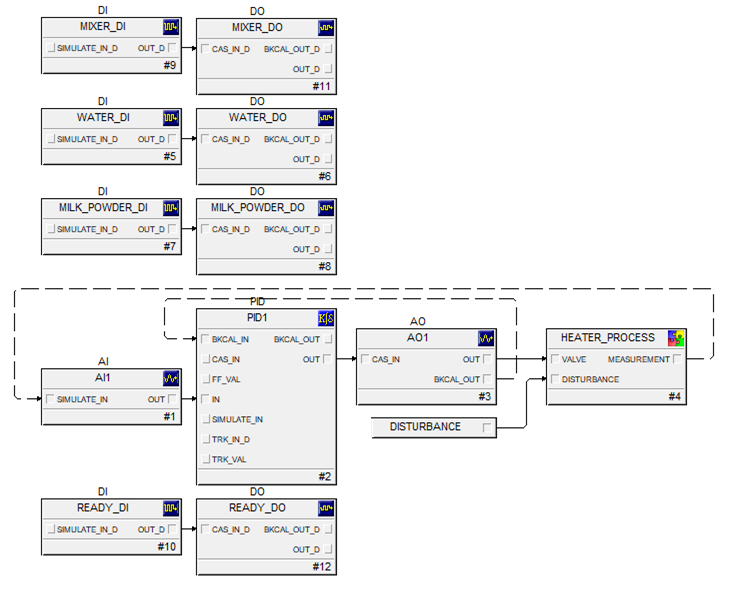
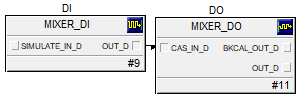
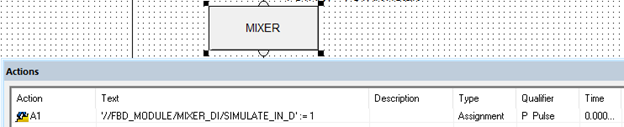
For example, in this program the mixer will be a single speed agitator. Its inputs are binary so it will either be ON or OFF.
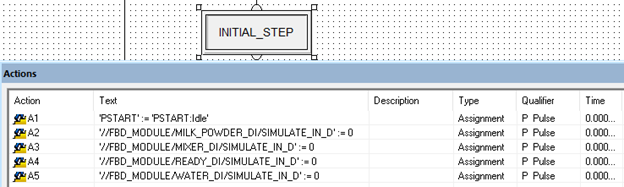
Since we are purely simulating this process it is important to enable the simulation parameter in each of the DI blocks and A1 as shown.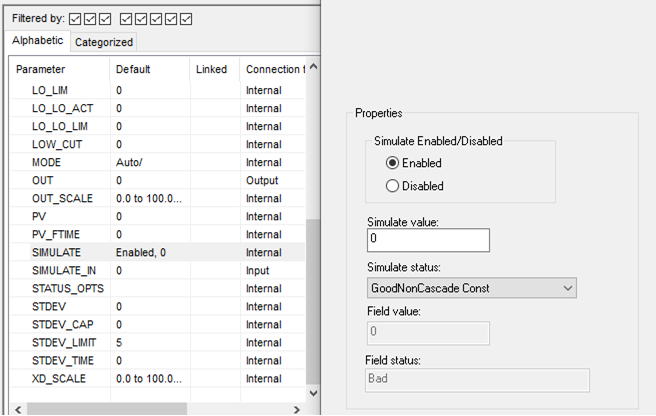
Heater process contains a deadtime block and a low pass filter and outputs an internal parameter called 'Measurement'. The filter will cause a phase shift in comparison to the PID output. This feature will prove an easy way to determine whether or not the heating process has settled on the set point and there is little to no overshoot occurring. The inputs to Gain and Disturbance will be 0 in this simulation but here is where you would alter these inputs if you were modelling your own controller. 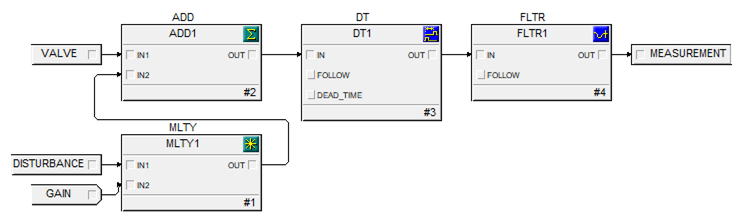
In the PID block "PID1" set the set point to 50 and change the mode to 'Auto'. The 50 will provide the default temperature the controller will settle on and Auto refers to how the PID tracks the IO.
Sequential Function Chart:
The SFC, or Sequential Function Chart, structures the process flow of the program into 'steps' and 'transitions'. These are represented by rectangles and cross-shaped icons respectively. The steps preform some sort of sequence, like a mixer turning on for 5 seconds, and the transition ensures that the mixer is off and that the step itself has been running for an acceptable amount of time (5 seconds in this example scenario).
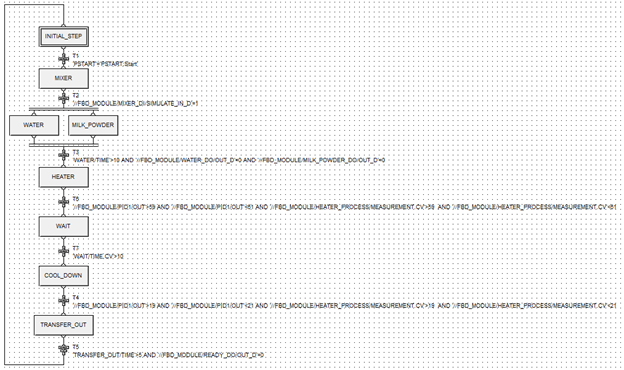
The first step is to initialise all parameters to their default state, in this case all the IO is set to 0 and the named set "PSTART" is set to Idle. So when a button press happens the sequencing can begin.
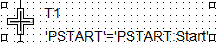
The first transition 'T1' requirement asks " Has the named set PSTART been set to start? " If yes then the sequencing begins.
The second step turns the mixer on.
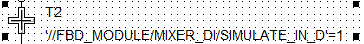
The second transition 'T2' asks " Is the input to the mixer 1?" or in other words "Is the mixer on?". If it is then it moves on to the next step.
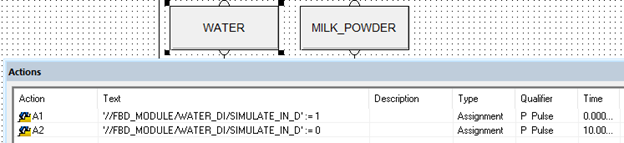
The third step is adding water to the tank for ten seconds then stopping.
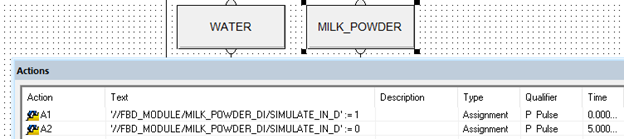
The fourth step is adding milk powder to the tank for 5 seconds and then stopping.
The third transition "T3" asks has the water step been active for more than 10 seconds (This value is chosen because it is the longest sequence in the collection of steps and MILK_POWDER, whose sequence length is 5 seconds, will be implicitly completed.) AND is WATER steps input =0 AND is MILK_POWDER steps input =0. If so then the program proceeds to the next step.

The fifth step is the Heater. Here the controller increases the set point to 60°c. Now the temperature will rise towards this point.
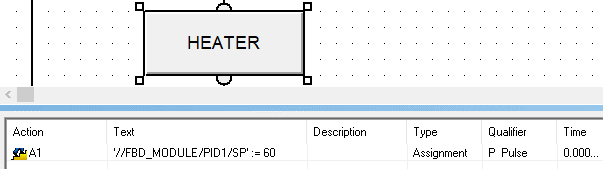
The fourth transition, "T4", performs a vital comparison. It asks if the output of the PID and the output of Heater_Process are within the range of 59°c and 61°c. Since these outputs are phase shifted, if they are all found to be TRUE at the same time this implies the system has settled and is considered stable.

The sixth step is a wait block, it is empty performs no direct function.
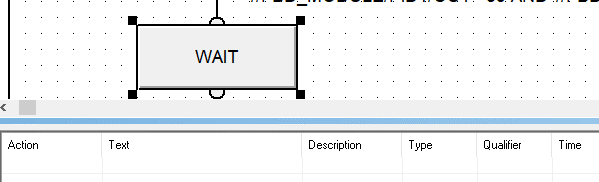
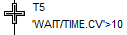
The fifth transition, named "T5", asks "Has the wait block been on for more the 10 seconds?" If yes then the step 4 of the recipe "Keep the mixture at 60°c for 10 seconds." is completed. Once that time is reached the program proceeds to the next step.
The seventh step cools the heater down by changing the PIDs set point to 20°c.
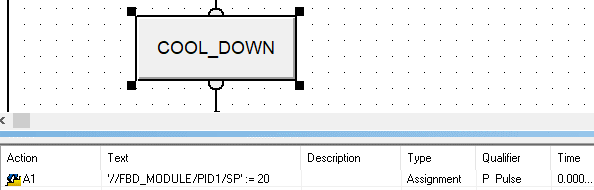
The sixth transition, named "T6", performs a vital comparison. It asks if the output of the PID and the output of the Heater_Process are within the range of 19°c and 21°c. Since these outputs are phase shifted if they are all found to be TRUE at the same time this implies the system has settled and is considered stable.

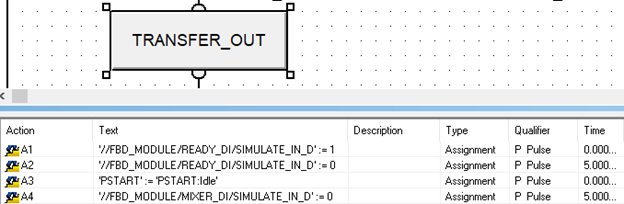
The last step, step 8, transfers out the contents of the tank for 5 seconds, resets the named set 'Pstart', and turns the mixer off.
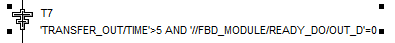
Finally, the termination of the process, "T7", asks has the mixture been transferred out for 5 seconds AND is the READY_DO =0? If yes the program returns to the initial step and waits for the permission to begin again.
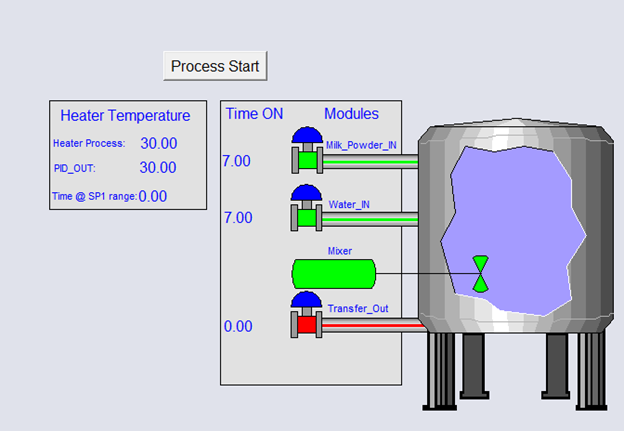
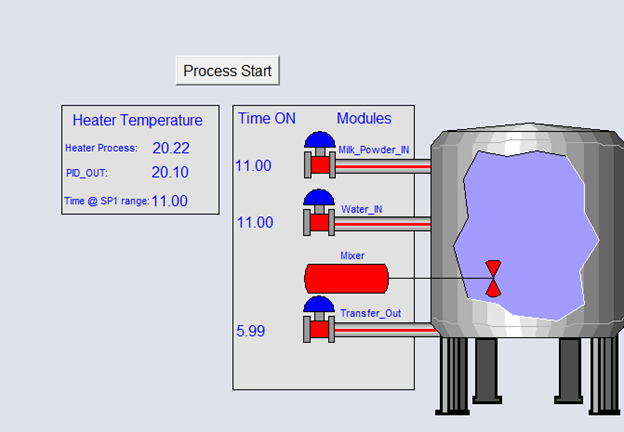
Animated Process Graphics:
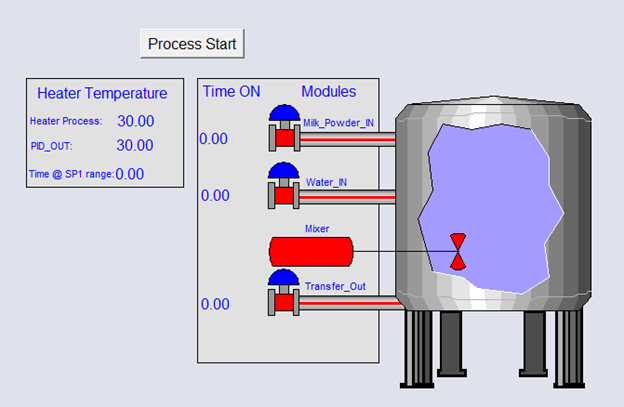
The default state, all modules are off and the heater is at around room temperature.
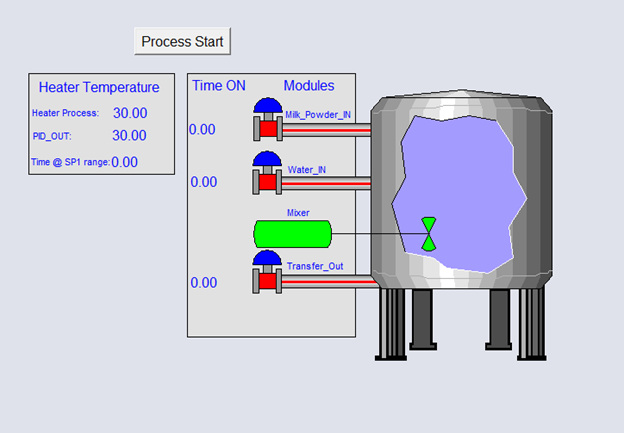
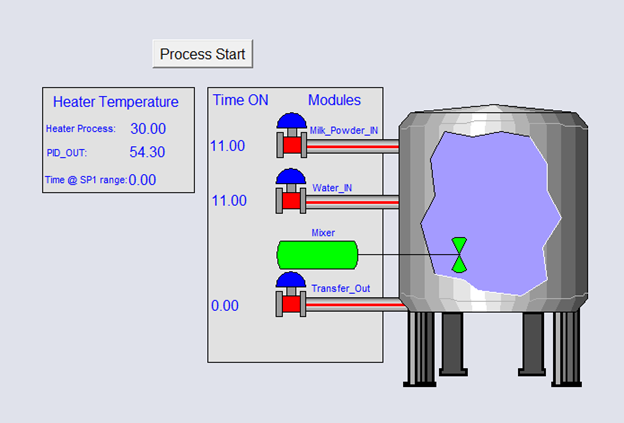
First the mixer turns on.
Then the milk powder gets added for 5 seconds and the water gets added for 10 seconds. These values are green until the transition to the next step which happens at 10 seconds. This is because the step block for milk powder, even though the code sets its input to false at 5 seconds, is considered active till the transition occurs.
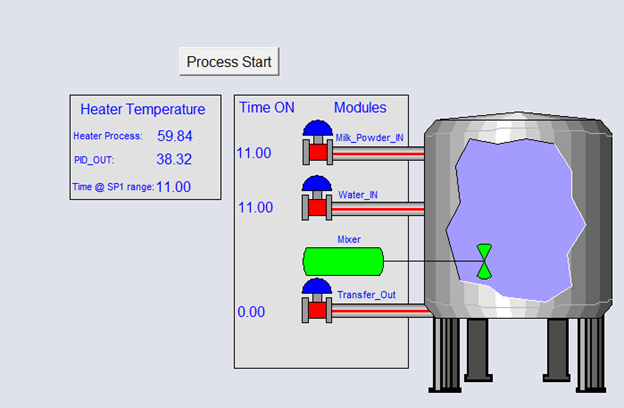
Once the ingredients are added the mixture is heated up to 60°c.
After the mixture is between a range of >59°c & <60°c for 10 seconds the mixture cools back down.
After the mixture is between a range of >19°c & <21°c for 10 seconds the mixture is transferred out for 5 seconds.
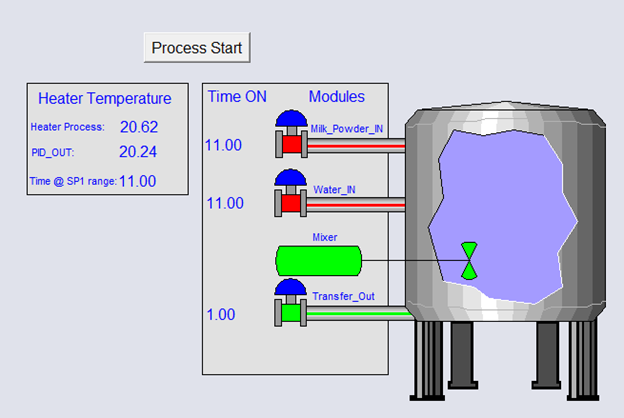
Then finally, the mixer is turned off and the program waits for another process start button press.
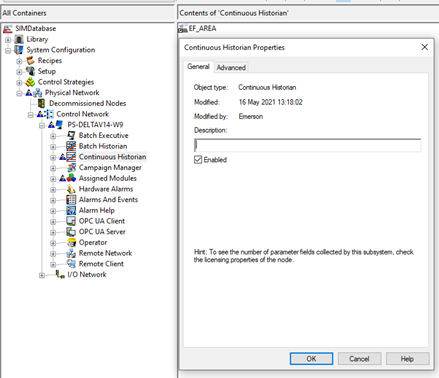
Heater Process Graph:
To create a graph to measure the controller outputs you must enable “Continuous Historian” as show and assign your area to the continuous historian.
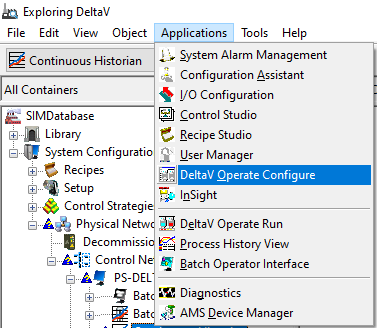
Open “DeltaV Operate Configure” and select “New Chart”.
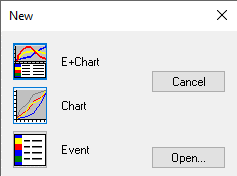
Then configure your chart but assigning your desired parameters.
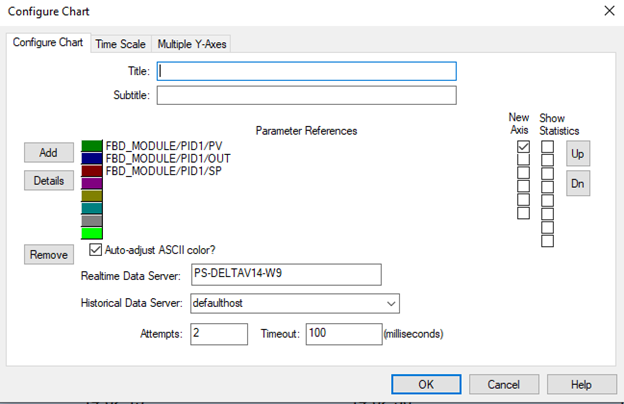
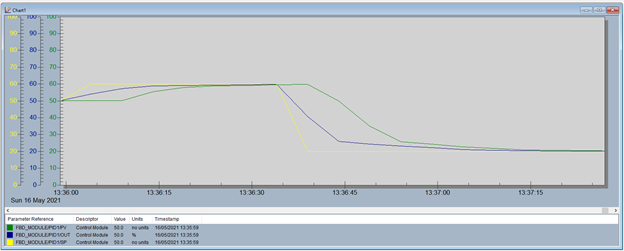
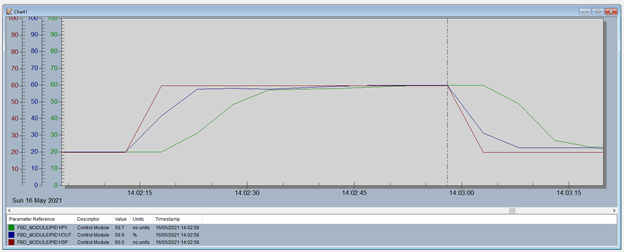
From this picture here you can see the temperature rise from the starting pint of 50°c to 60°c. Them it stays at 60°c for 10 seconds then the set point changers and the heater cools to 20°c.
I wanted the temperature to reach the set point a little bit quicker but still not overshoot the set point so I raised the Gain from 0.4 to 0.45 and got the following results.
Here you can see the start point at which the values at PID_OUT and Measurement are both within the ranges of 59 and 61. At this point the transition to the wait block would occur. Ten seconds pass before the set point changes for the cooling phase.
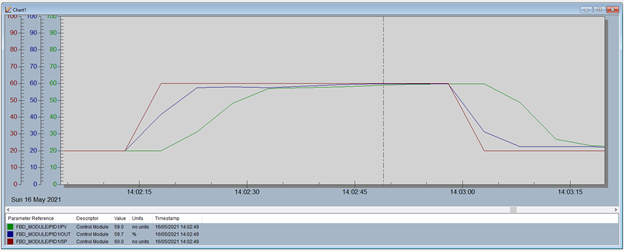
You can see that the process starts at 14:02:13.
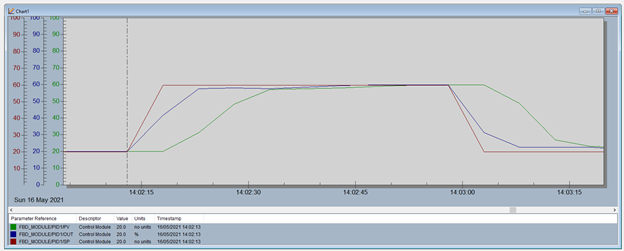
And ends at 14:02.58. A reasonable time for the mixture to heat up, which of course includes the 10 seconds of a stable output of between 59°c and 61°c.
Thank you for reading through this article, and if you have any further questions please feel free to reach out to me at:
contact@appliedprojectsengineering.com